Are Blacks The Lowest Class in Amerca – Let’s Ask Ron
Here’s the most up-to-date ranking based on official U.S. Census Bureau data (2024, released in 2025). “Successful living” or standard of living is subjective, but the most objective, commonly used economic measures are median household income (primary indicator here) and poverty rates. These reflect earnings, resources, and economic well-being for households.
The data comes from the Current Population Survey (CPS) and covers all U.S. households, including native-born citizens, legal immigrants, and undocumented immigrants (to the extent they are captured in surveys). Undocumented immigrants are predominantly of Hispanic/Latino origin and tend to have lower average incomes/education levels, which is already reflected in the Hispanic group averages. Asian immigrants are more often legal/high-skilled and boost that group’s figures.
Ranking by Median Household Income (2024, inflation-adjusted dollars)
This is the clearest single measure of economic success/standard of living:
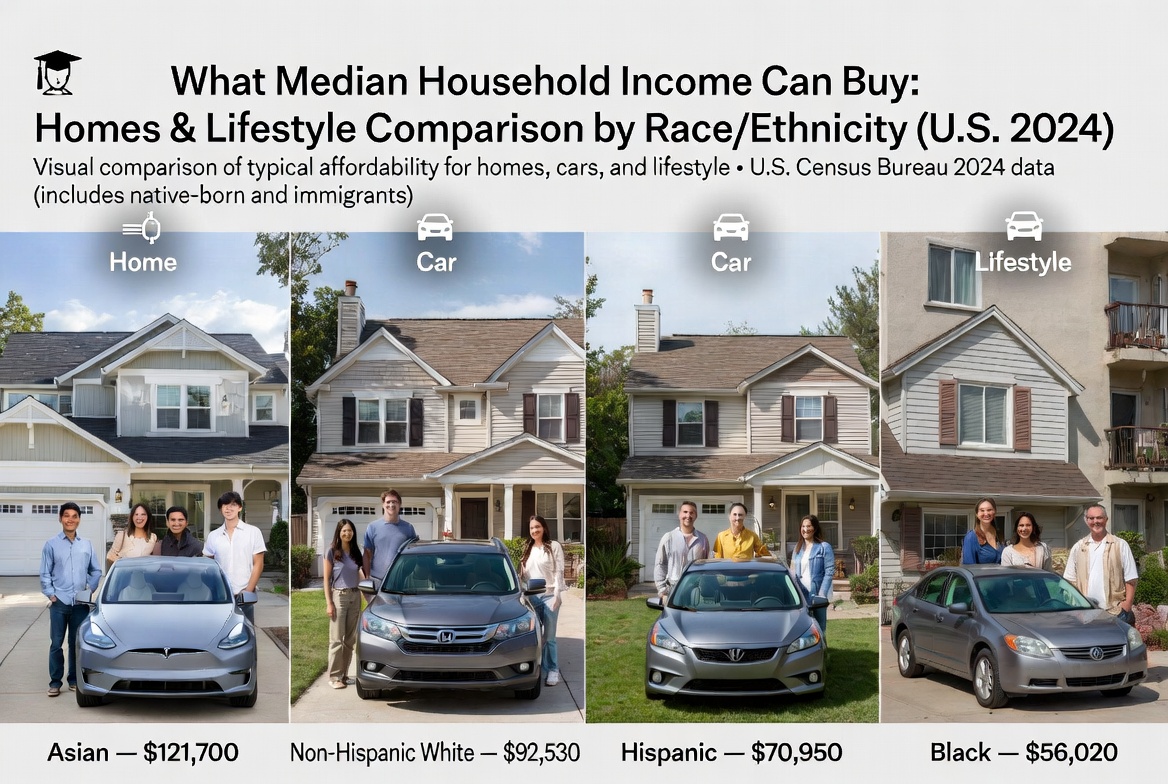
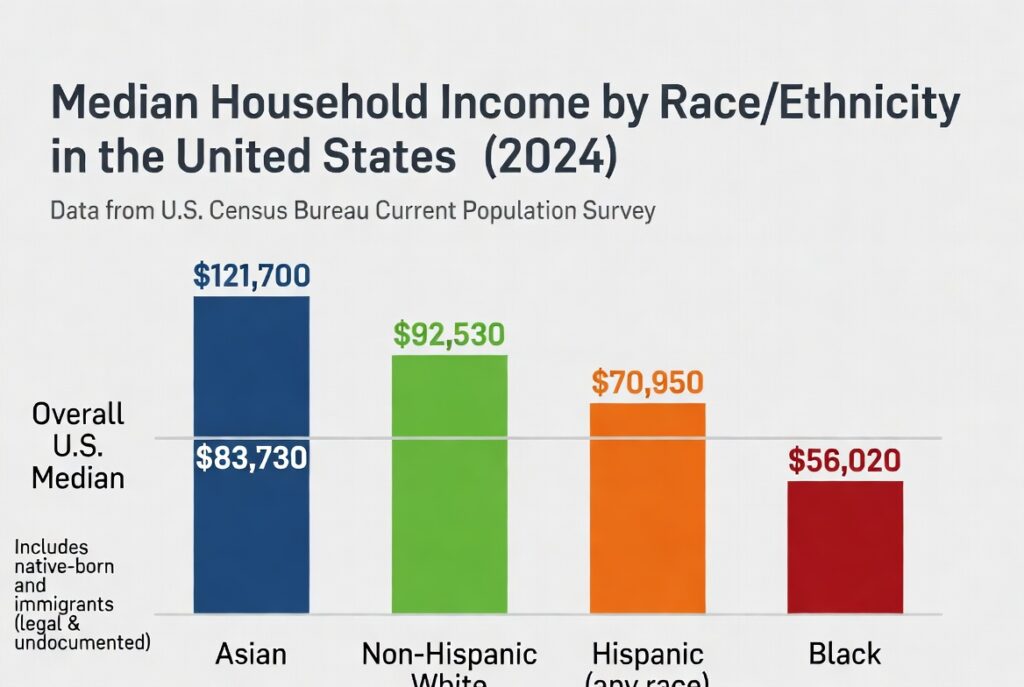
- Asian households: $121,700 (highest)
- Non-Hispanic White households: $92,530
- Hispanic (any race) households: $70,950
- Black households: $56,020 (lowest among major groups)
Overall U.S. median household income: $83,730.
Notes on other race groups (smaller populations):
- American Indian and Alaska Native (AIAN): Typically lower than Black (around mid-$50k range in recent years).
- Native Hawaiian/Other Pacific Islander and multiracial: Vary but generally between Hispanic and Black.
Supporting Metrics (Consistent Pattern)
- Poverty rates (2024, official measure):
- Asian: 7.5% (lowest)
- Non-Hispanic White: ~7.6%
- Hispanic (any race): 15.0%
- Black: 18.4%
- AIAN: 19.3% (highest) Overall U.S. poverty rate: 10.6%.
- Median net worth/wealth (most recent detailed data ~2022–2023 from Federal Reserve SCF and Census SIPP; patterns hold): Asians highest (often $384k+), followed by non-Hispanic Whites (~$250k–$285k), then Hispanics (~$62k), then Blacks (~$33k–$44k). Wealth gaps are larger than income gaps due to historical factors like homeownership and inheritance.
- Homeownership rates (recent trends, ~2023–2024 data): Non-Hispanic White highest (~73–74%), Asian (~60–63%), Hispanic (~50%), Black (~45–46%). Immigrants overall have lower rates than native-born, but this varies sharply by group (e.g., Asian legal immigrants often catch up quickly).
Key Context on Immigrants
- Legal vs. illegal: Census data does not separate legal/illegal status directly, but it includes both. High-income Asian averages are driven heavily by legal immigrants (e.g., from India, China, Korea via skilled visas). Many Hispanic averages are lowered by recent/undocumented Latin American immigrants with lower average education and English proficiency. Second-generation immigrants often show strong upward mobility across groups.
- Subgroup variation is huge (e.g., Indian Americans or Nigerian immigrants outperform national averages; Mexican or Central American immigrants lag initially but improve over generations). Broad “race” categories mask this.
These are group averages and do not apply to individuals. Factors like education, age, family structure, location, and discrimination also play roles, but the empirical ordering has been consistent for decades across income, poverty, wealth, and education metrics. Data is from the latest available Census releases as of 2025/2026—no newer comprehensive 2025 income figures exist yet.